File:Ukrainian parliamentary election, 2007 (ResultsByRegion).PNG
Non sono disponibili versioni a risoluzione più elevata.
Ukrainian_parliamentary_election,_2007_(ResultsByRegion).PNG (768 × 480 pixel, dimensione del file: 15 KB, tipo MIME: image/png)
| Questo file e la sua pagina di descrizione (discussione · modifica) si trovano su Wikimedia Commons (?) |
.PNG?uselang=it)
.PNG)
.PNG&action=edit)
Dettagli
| Descrizione |
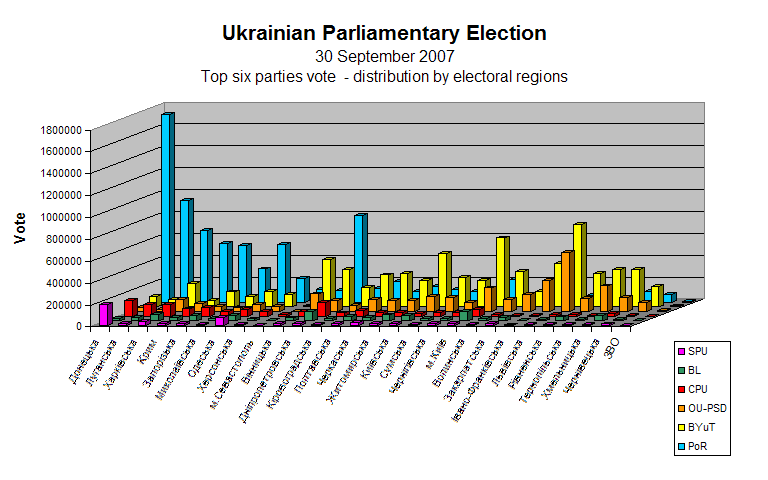
English: Ukrainian parliamentary election, 2007. |
| Data | |
| Fonte | Self-made based off map by Muumi with data from Central Election Commission of Ukraine |
| Autore | User:DemocracyATwork |
| Licenza (Riusare questo file) |
Questo file è licenziato in base ai termini della licenza Creative Commons Attribuzione-Condividi allo stesso modo 1.0 Generico Attribuzione: DemocracyATwork
|
| Altre versioni |
|
.PNG)
Collection
.PNG) |
.PNG) |
.PNG)
|
Regional Analysis of the parliamentary elections:
.PNG) |
.PNG)
|
.PNG)
|
.PNG)
|
v.PNG) |
v.PNG) |
v.PNG) |
v.PNG) |
v.PNG) |
v.PNG) |
a.PNG) |
a.PNG) |
a.PNG) |
a.PNG) |
a.PNG) |
a.PNG) |
.PNG) |
.PNG) |
.PNG) |
.PNG) |
.PNG) |
.PNG) |
2006 [7] [8] [9] [10] [11] [12]
A swing analysis is common in any election. It shows the change in voter percentage for each party by regions from 2006 to 2007.
Licenza
| Io, detentore del copyright su quest'opera, la rilascio nel pubblico dominio. Questa norma si applica in tutto il mondo. In alcuni paesi questo potrebbe non essere legalmente possibile. In tal caso: Garantisco a chiunque il diritto di utilizzare quest'opera per qualsiasi scopo, senza alcuna condizione, a meno che tali condizioni siano richieste dalla legge. |
- ↑ Template:Cite gov
- ↑ Template:Cite gov
- ↑ Template:Cite gov
- ↑ Template:Cite gov
- ↑ Template:Cite gov
- ↑ Template:Cite gov
- ↑ Template:Cite gov
- ↑ Template:Cite gov
- ↑ Template:Cite gov
- ↑ Template:Cite gov
- ↑ Template:Cite gov
- ↑ Template:Cite gov
Cronologia del file
Fare clic su un gruppo data/ora per vedere il file come si presentava nel momento indicato.
| Data/Ora | Miniatura | Dimensioni | Utente | Commento | |
|---|---|---|---|---|---|
| attuale | 19:09, 20 feb 2008 | | 768 × 480 (15 KB) | DemocracyATwork | Ukrainian Parliamentary Election 2007 Results of election (Top six parties vote by region) chart. Removed boarder. |
| 01:09, 18 feb 2008 |  | 750 × 479 (14 KB) | DemocracyATwork | Update to reflect color change for Bloc Lytvyn to match with the Parliamentary seat allocation map. From grey to geen. | |
| 16:32, 13 feb 2008 |  | 750 × 479 (14 KB) | DemocracyATwork | == Summary == {{Information |Description='''English:''' Ukrainian parliamentary election, 2007 sorted to better correlate to data table. |Source=Self-made based off [[:Image:Wahlkreise ukraine 2006 eng.png|ma | |
| 10:52, 8 feb 2008 |  | 750 × 479 (19 KB) | DemocracyATwork | == Results - Ukrainian Election 2007 Collection == {| class="wikitable" |- |+ Results of the Ukrainian parliamentary elections: |- | 400px|center|Top six parties vote | [[Image:Ukrainian parliame |
.PNG)
Pagine che usano questo file
La seguente pagina usa questo file:
Utilizzo globale del file
Anche i seguenti wiki usano questo file:
- Usato nelle seguenti pagine di ca.wikipedia.org:
- Usato nelle seguenti pagine di de.wikipedia.org:
- Usato nelle seguenti pagine di en.wikipedia.org:
- Talk:Yulia Tymoshenko Bloc
- Talk:Party of Regions
- Talk:Our Ukraine–People's Self-Defense Bloc
- Talk:Elections in Ukraine
- Talk:2007 Ukrainian parliamentary election/Archive 1
- File talk:Ukrainian parliamentary election 2007 second place resultsNeutral.PNG
- User talk:DemocracyATwork~enwiki
- File talk:Ukrainian parliamentary election, 2007 (first place results).PNG
- User talk:Yulia Romero/Archive 2
- Usato nelle seguenti pagine di es.wikipedia.org:
- Usato nelle seguenti pagine di fi.wikipedia.org:
- Usato nelle seguenti pagine di fr.wikipedia.org:
- Usato nelle seguenti pagine di hu.wikipedia.org:
- Usato nelle seguenti pagine di pl.wikipedia.org:
- Usato nelle seguenti pagine di ru.wikipedia.org:
- Usato nelle seguenti pagine di uk.wikipedia.org:
.PNG)
.PNG)