File:Halogenated gas concentrations 1978-present.png
Dimensioni di questa anteprima: 800 × 516 pixel. Altre risoluzioni: 320 × 206 pixel | 640 × 412 pixel | 928 × 598 pixel.
File originale (928 × 598 pixel, dimensione del file: 24 KB, tipo MIME: image/png)
| Questo file e la sua pagina di descrizione (discussione · modifica) si trovano su Wikimedia Commons (?) |
Dettagli

|
Questo file può essere aggiornato per contenere nuove informazioni. Se si desidera utilizzare una versione specifica del file senza i nuovi aggiornamenti, è necessario caricare la versione richiesta in un file separato. |
| Descrizione |
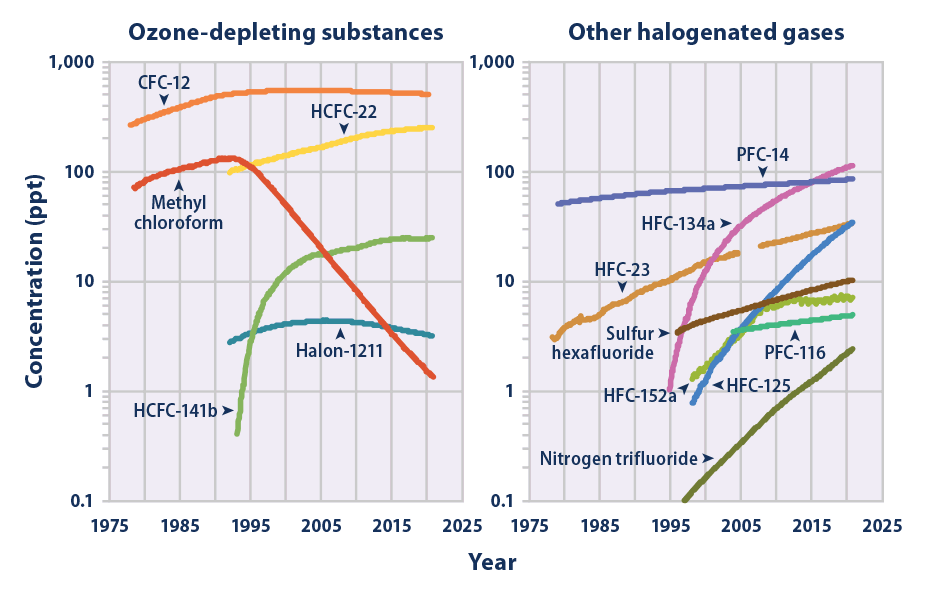
English: The two graphs show global changes in the concentration (measured in parts per trillion, or ppt) of several important halogenated gases in Earth's atmosphere. The data were collected from sites around the world between years 1978 and 2021. The left graph shows gases which cause substantial ozone depletion, as well as atmospheric heating. The right graph shows gases whose main impact is global warming.
All of the gases are human-made and manufactured in industrial amounts starting as early as the mid-twentieth century. Severe depletion of Earth's protective ozone layer inspired efforts to reduce the production of some gases starting the late 1980s. Overall, the manufacture of most other gases is still rapidly increasing, as indicated by the logarithmic scale used to graph the concentrations. Data Sources/References:
|
| Data | |
| Fonte | https://www.epa.gov/climate-indicators/climate-change-indicators-atmospheric-concentrations-greenhouse-gases |
| Autore | United States Environmental Protection Agency - Unauthored |
Licenza
Questa immagine o file multimediale è di pubblico dominio poiché contiene materiale proveniente della National Oceanic and Atmospheric Administration, realizzato da personale dipendente durante l'assolvimento dei propri compiti ufficiali.
|
Cronologia del file
Fare clic su un gruppo data/ora per vedere il file come si presentava nel momento indicato.
| Data/Ora | Miniatura | Dimensioni | Utente | Commento | |
|---|---|---|---|---|---|
| attuale | 08:37, 29 ago 2022 | | 928 × 598 (24 KB) | A876 | updated by author to cover 1978-2021. |
| 02:03, 15 apr 2022 |  | 928 × 598 (24 KB) | A876 | compacted. octree from RGB (3348 colors) (no noticeable change) to 256 colors. zopfli png compression (lossless). | |
| 01:49, 15 apr 2022 |  | 928 × 598 (74 KB) | A876 | updated by author to cover 1978-2018. (includes ALL of the previous version (1978-2015), so REPLACING it is no loss.) | |
| 19:05, 25 set 2020 |  | 928 × 598 (77 KB) | Bikesrcool | Uploaded a work by United States Environmental Protection Agency - Unauthored from https://www.epa.gov/climate-indicators/climate-change-indicators-atmospheric-concentrations-greenhouse-gases with UploadWizard |
Pagine che usano questo file
La seguente pagina usa questo file:
Utilizzo globale del file
Anche i seguenti wiki usano questo file:
- Usato nelle seguenti pagine di bn.wikipedia.org:
- Usato nelle seguenti pagine di en.wikipedia.org:
- Usato nelle seguenti pagine di es.wikipedia.org:
- Usato nelle seguenti pagine di fr.wikipedia.org:
- Usato nelle seguenti pagine di zh.wikipedia.org: